Campaign portfolio

PPC Portfolio | Google Ads & Facebook Ads Results

Anonymous campaign reports from Google Ads, Facebook Ads and GA4 Paid Search. Inspect the original reporting periods, visible metrics and measurement notes without exposing client identities.

Browse Google Ads sales reports, Facebook Ads purchase reports or GA4 tracking and attribution. Click a screenshot or full-size link to inspect the watermarked source.

Selected campaign reports

Google Ads

Sales Performance
Jul–Aug 2024

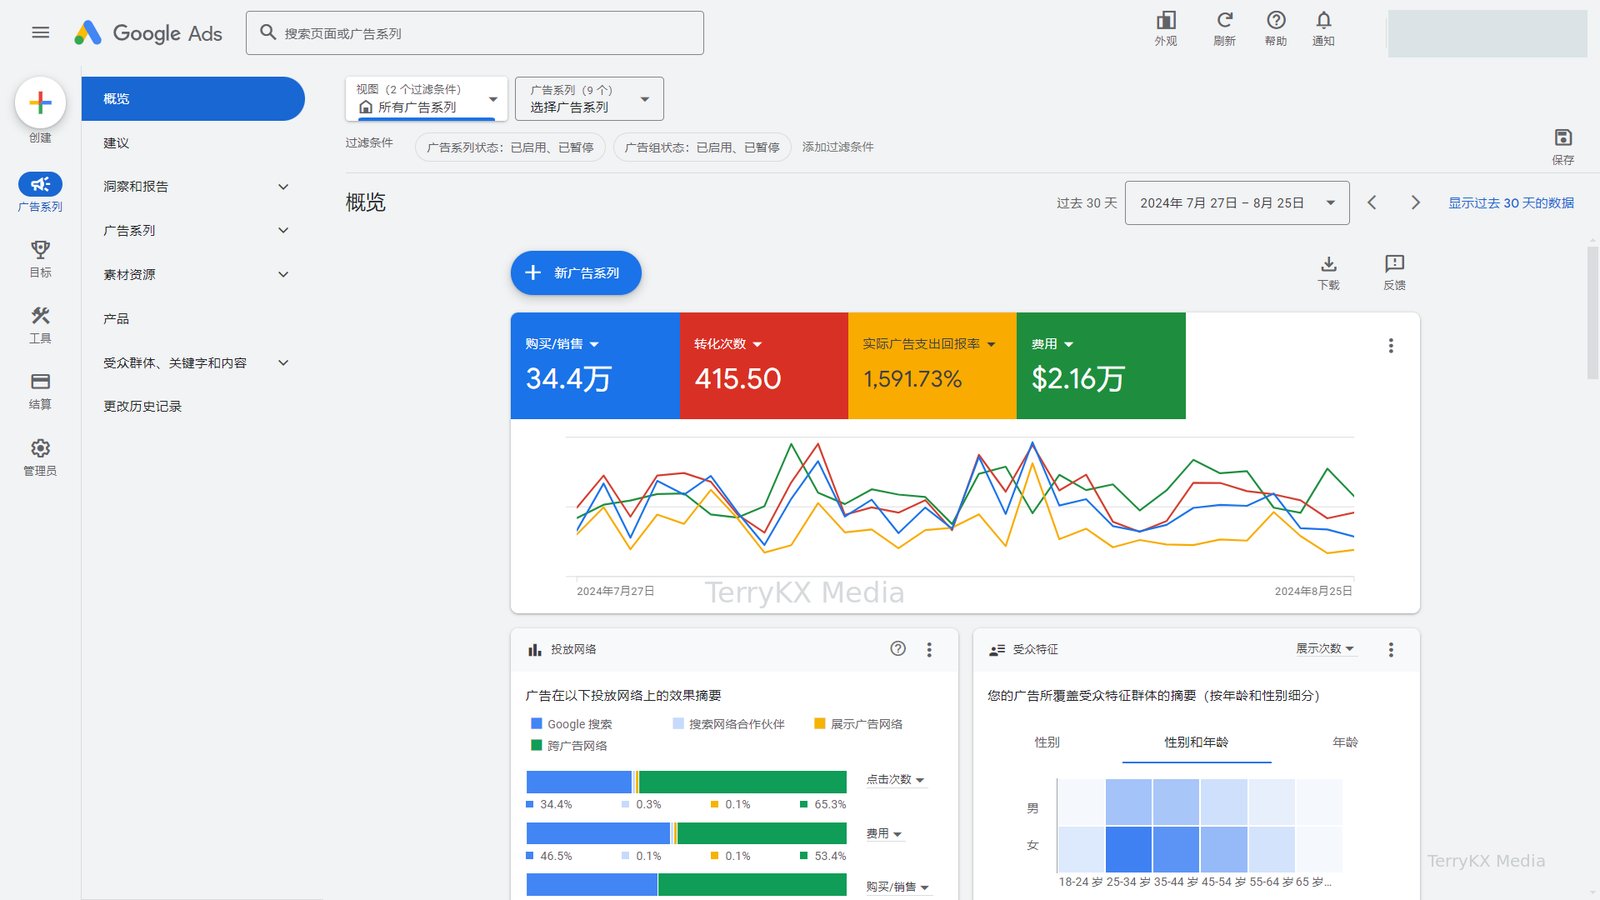
Google Ads reporting overview

15.92x

ROAS

415.50

Conversions

≈344K

Purchase/sales value

Reporting period
27 Jul 2024 – 25 Aug 2024
Ad spend: ≈$21.6K

The overview reports 1,591.73% ROAS and 415.50 reported conversions. Purchase/sales value is displayed as 344K and cost as $21.6K, both rounded in the original report.

Google Ads

Sales Performance
Dec 2023–Jan 2024

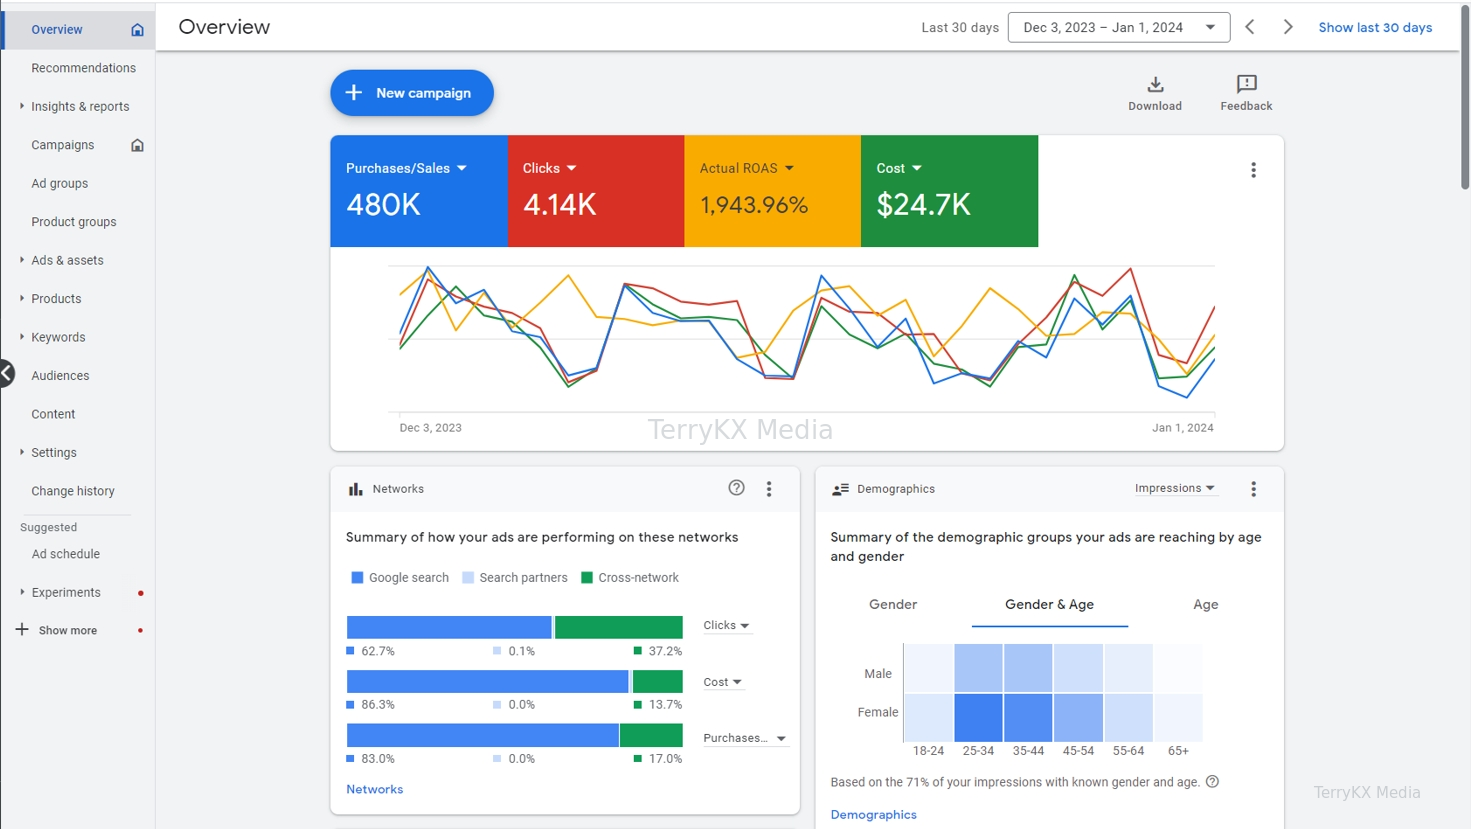
Google Ads reporting overview

19.44x

ROAS

≈$24.7K

Ad spend

≈480K

Purchase/sales value

Reporting period
3 Dec 2023 – 1 Jan 2024
Clicks: ≈4.14K

The overview reports 1,943.96% ROAS, with purchase/sales value displayed as 480K and cost as $24.7K. It shows 4.14K clicks; a conversion count is not visible.

Facebook Ads

Website Purchases
Jul 2024

Facebook Ads Manager report

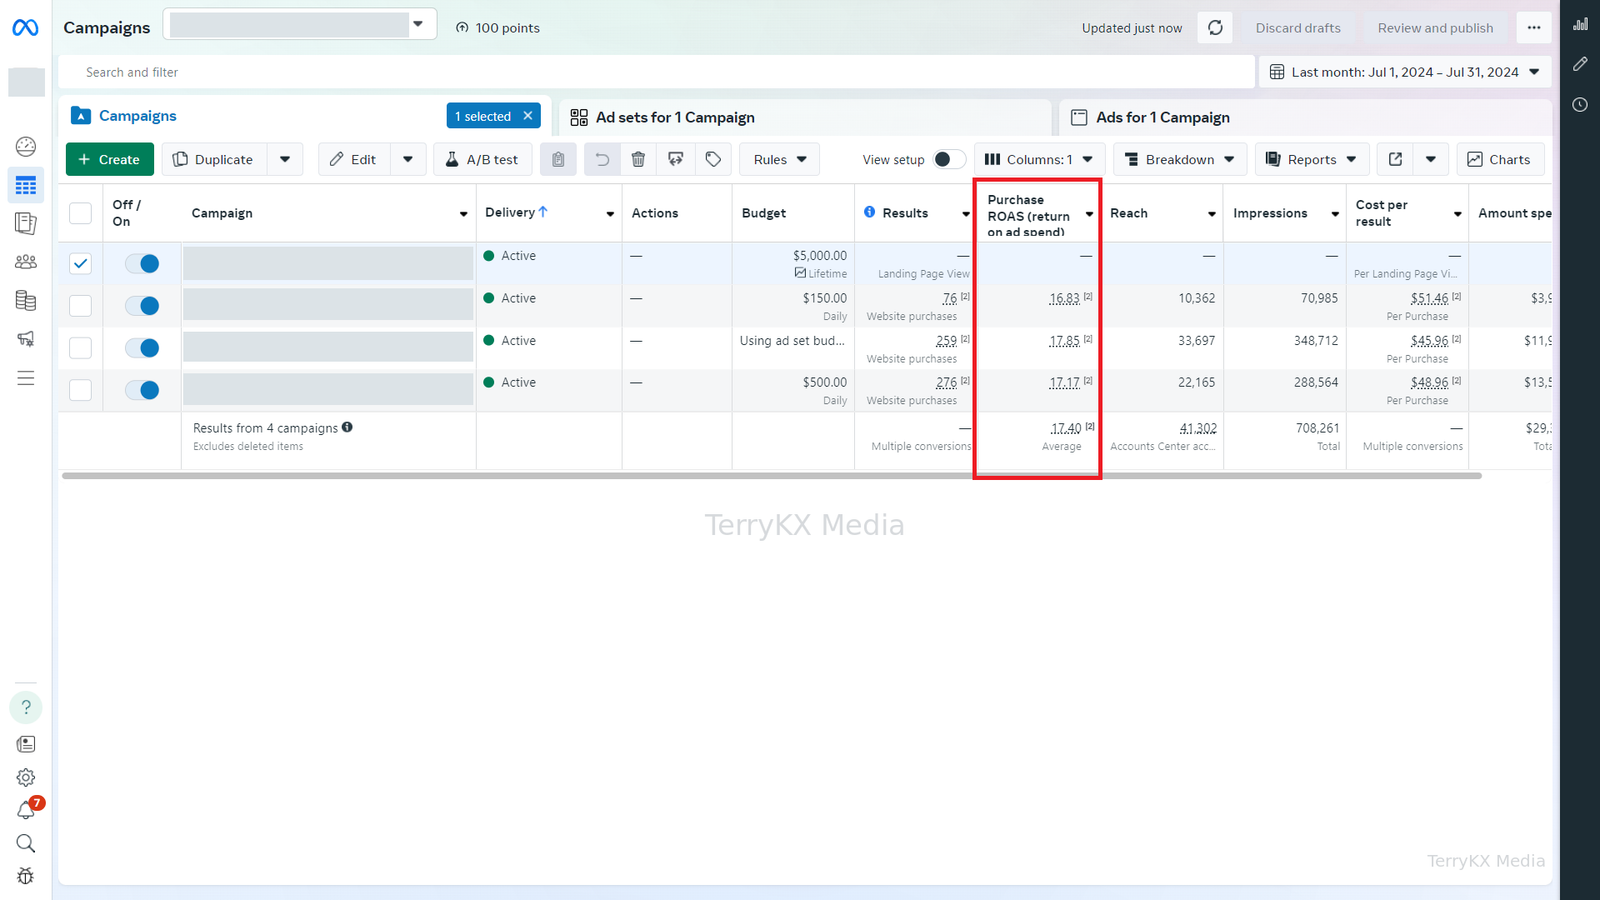
17.40x

Average purchase ROAS

611

Visible purchases

Reporting period
1 Jul 2024 – 31 Jul 2024

The report shows average Purchase ROAS of 17.40x. The three visible purchase campaigns record 76, 259 and 276 purchases, totalling 611. Their cost per purchase ranges from $45.96 to $51.46. Complete spend and purchase value are not visible.

Facebook Ads

Website Purchases
Nov 2023

Facebook Ads Manager report

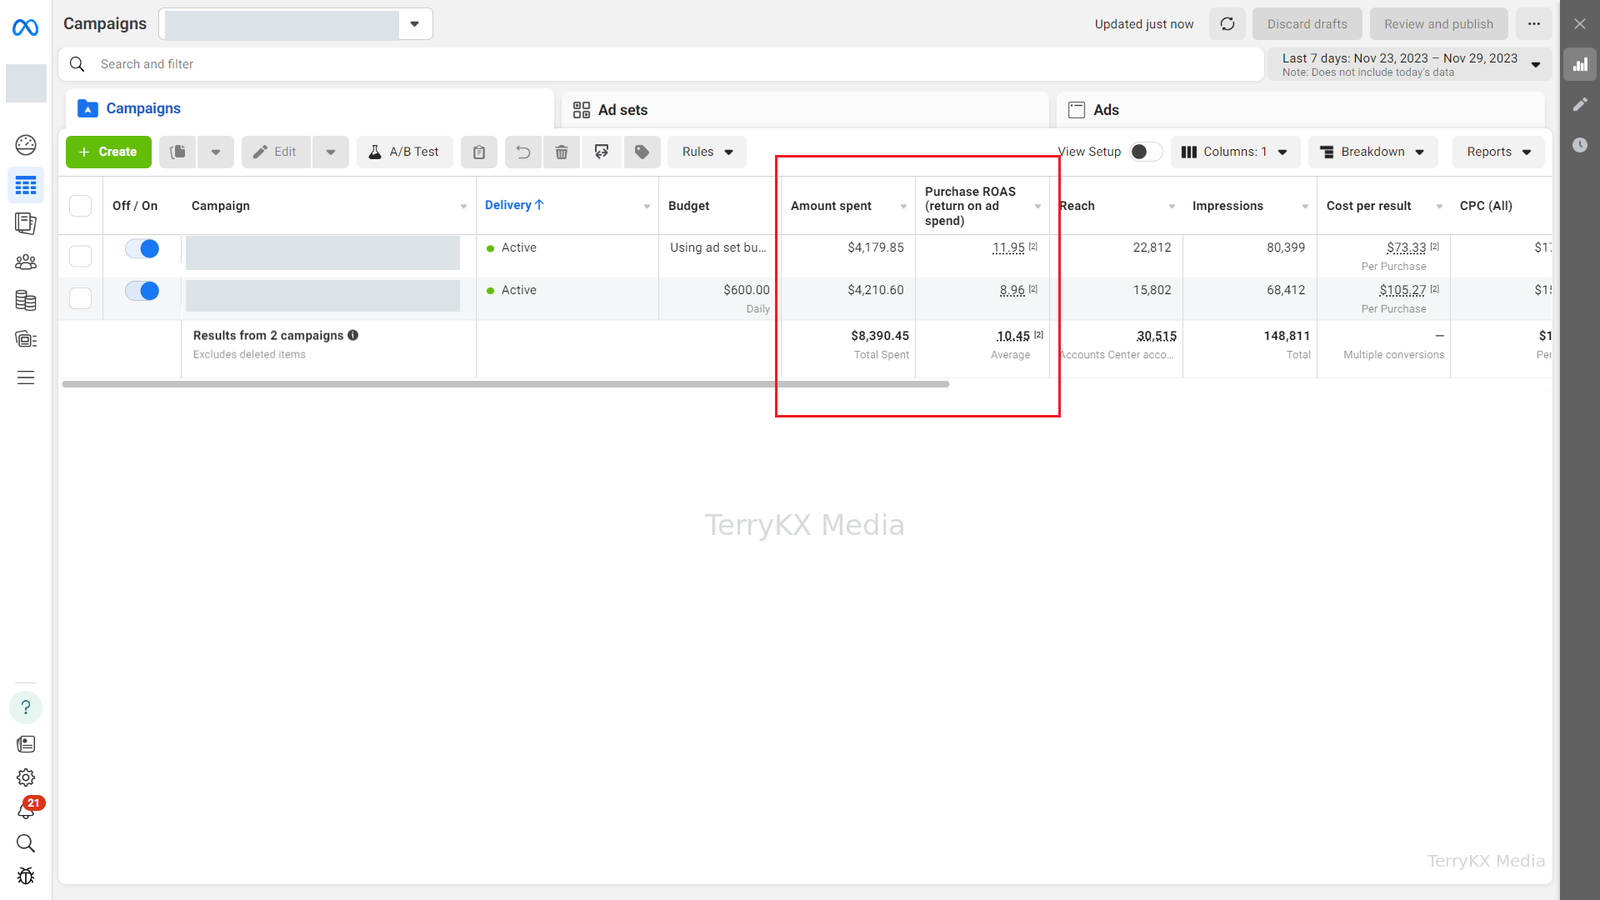
10.45x

Average purchase ROAS

≈$8.39K

Ad spend

Reporting period
23 Nov 2023 – 29 Nov 2023

Ad spend: $8,390.45. Cost per purchase across the two visible campaigns: $73.33–$105.27.

A two-campaign website purchase report shows $8,390.45 in spend and 10.45x average purchase ROAS. Purchase count and conversion value are not visible in this screenshot.

Facebook Ads

Purchases by Placement
Jul 2024

Facebook and Instagram placement report

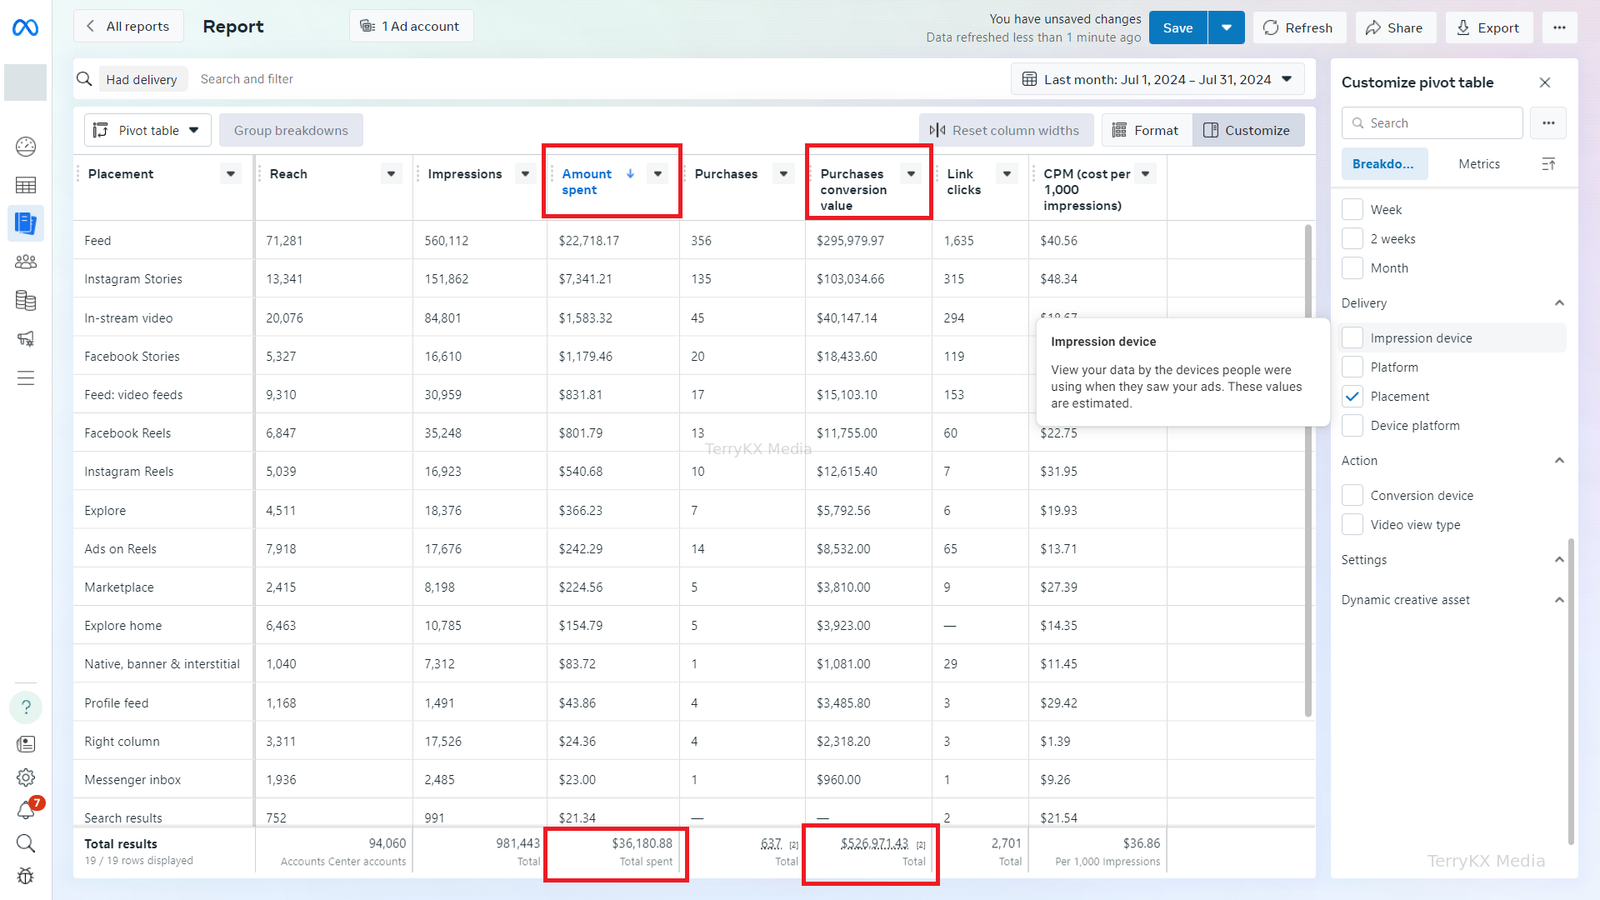
14.56x

Calculated ROAS

637

Purchases

Reporting period
1 Jul 2024 – 31 Jul 2024

Ad spend: $36,180.88. Purchase conversion value: $526,971.43.

The placement report records 637 purchases and $526,971.43 in purchase conversion value. ROAS is calculated as conversion value divided by $36,180.88 in ad spend; individual placements remain visible in the full report.

Facebook Ads

Platform & Placement
Jul–Aug 2024

Facebook and Instagram report breakdowns

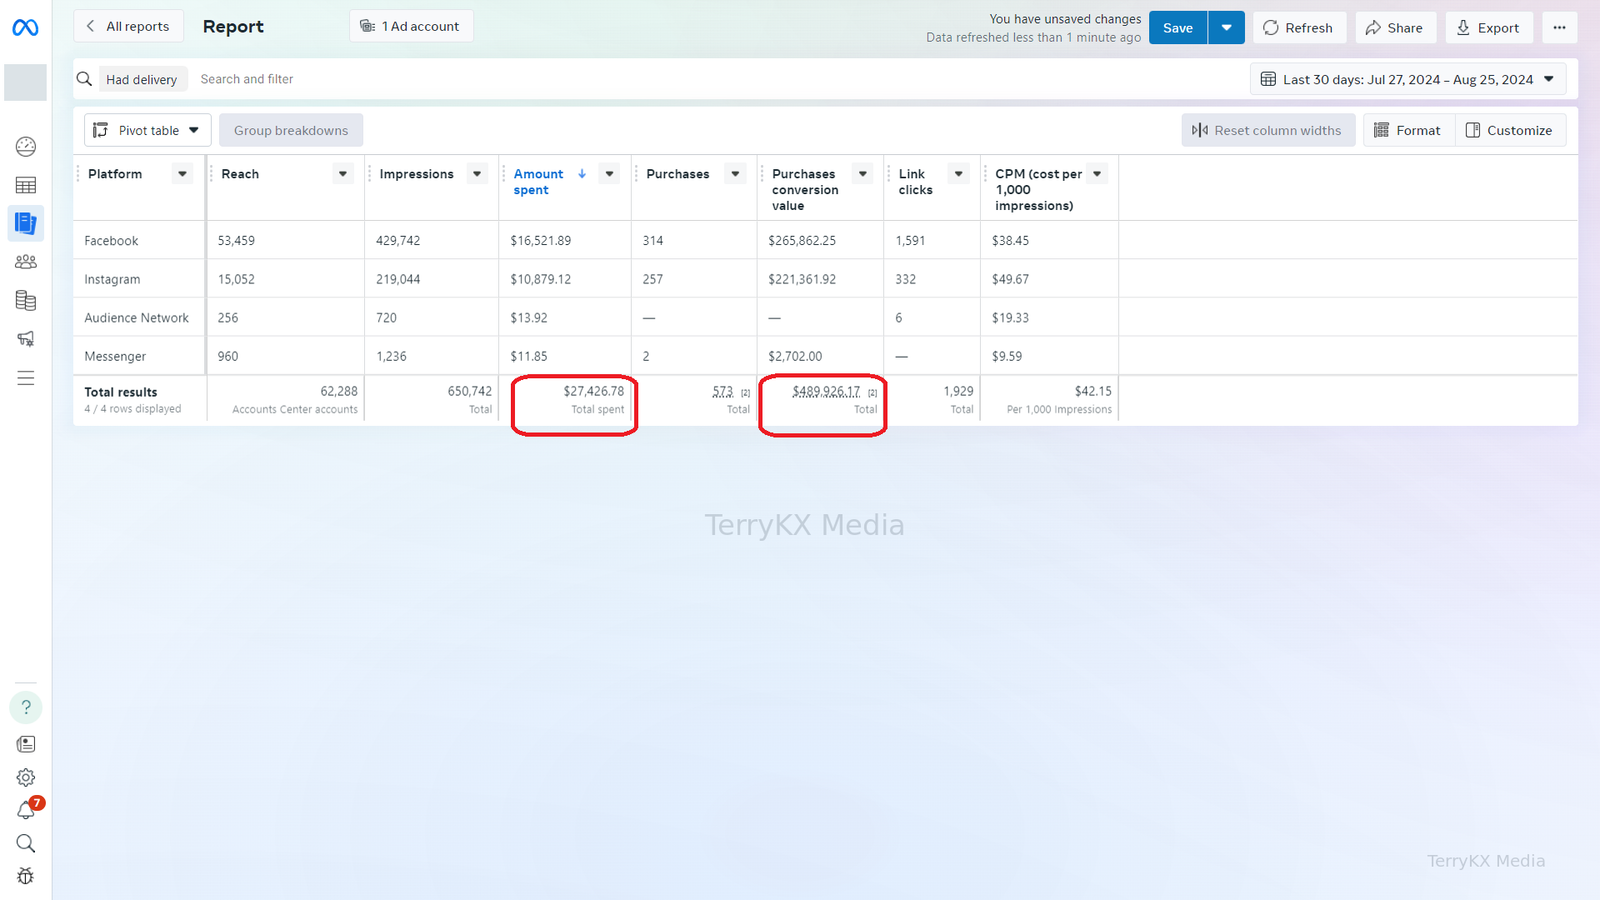
17.86x

Calculated ROAS

573

Purchases

Reporting period
27 Jul 2024 – 25 Aug 2024

Ad spend: $27,426.78. Purchase conversion value: $489,926.17.

Platform and placement breakdowns show the same reporting period and matching totals, so they are presented as two views of one case. ROAS is calculated from reported purchase conversion value divided by ad spend; the reports are not added together.

Facebook Ads

Purchases by Placement
Jan–Oct 2025

Facebook and Instagram placement report

23.97x

Calculated ROAS

6,467

Purchases

Reporting period
1 Jan 2025 – 1 Oct 2025

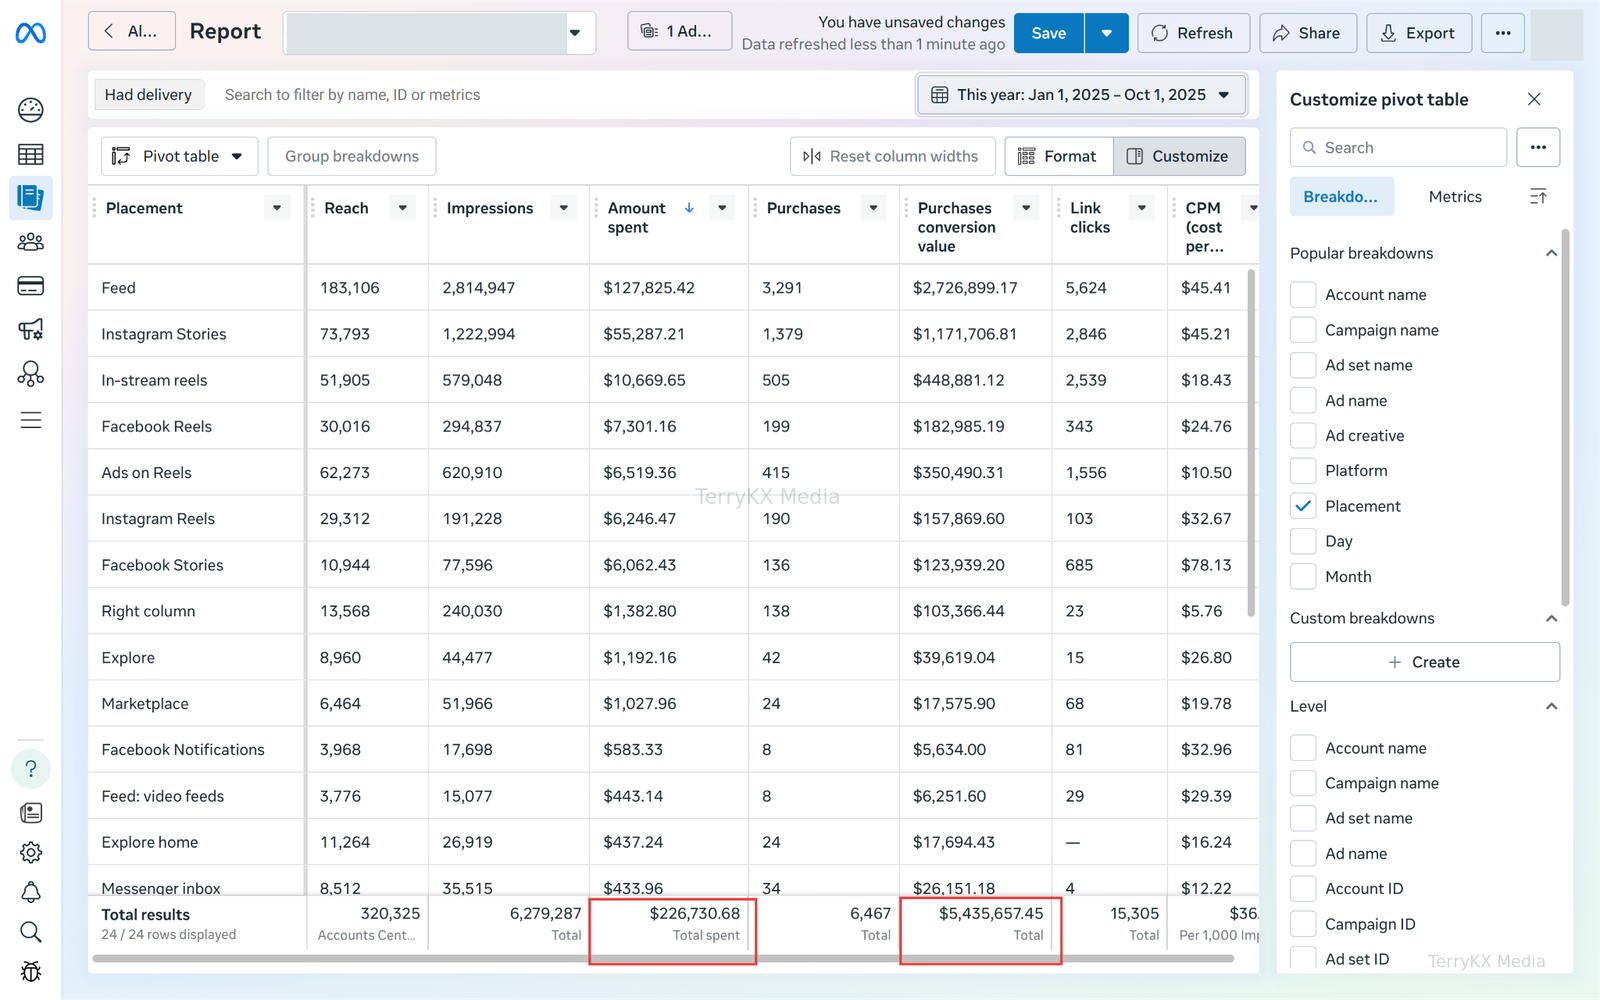
Ad spend: $226,730.68. Purchase conversion value: $5,435,657.45.

The reporting period records 6,467 purchases, $226,730.68 in ad spend and $5,435,657.45 in purchase conversion value. The 23.97x ROAS is calculated from these reported totals, with placement-level figures available in the screenshot.
Facebook Ads

Website Purchases
Sep 2025

Facebook Ads Manager report

44.59x

Average purchase ROAS

112

Visible purchases

Reporting period
24 Sep 2025 – 30 Sep 2025

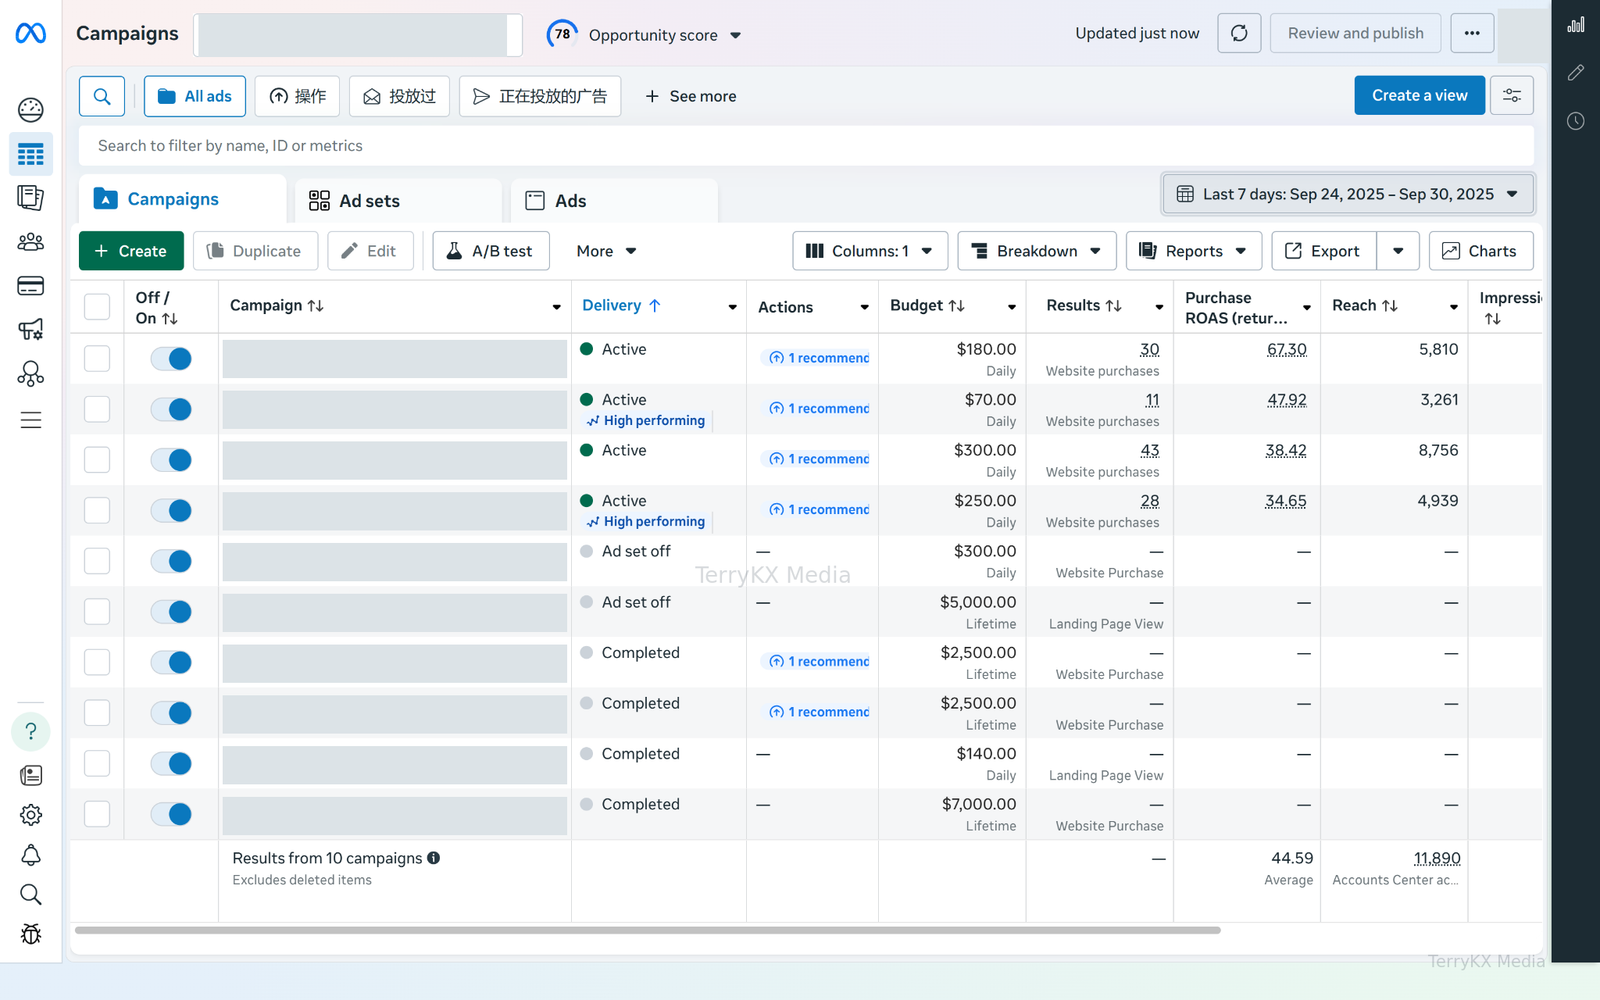
112 purchases across four visible website purchase campaigns. Ad spend and conversion value are not visible.

Four visible campaigns report 30, 11, 43 and 28 website purchases, totalling 112 visible purchases. Ads Manager displays 44.59x average purchase ROAS; this is kept separate from the purchase count because an account-wide purchase total is not shown.

Facebook Ads

Website Purchases
Apr–May 2026

Facebook Ads Manager report

29.06x

Average purchase ROAS

373

Visible purchases

Reporting period
28 Apr 2026 – 11 May 2026

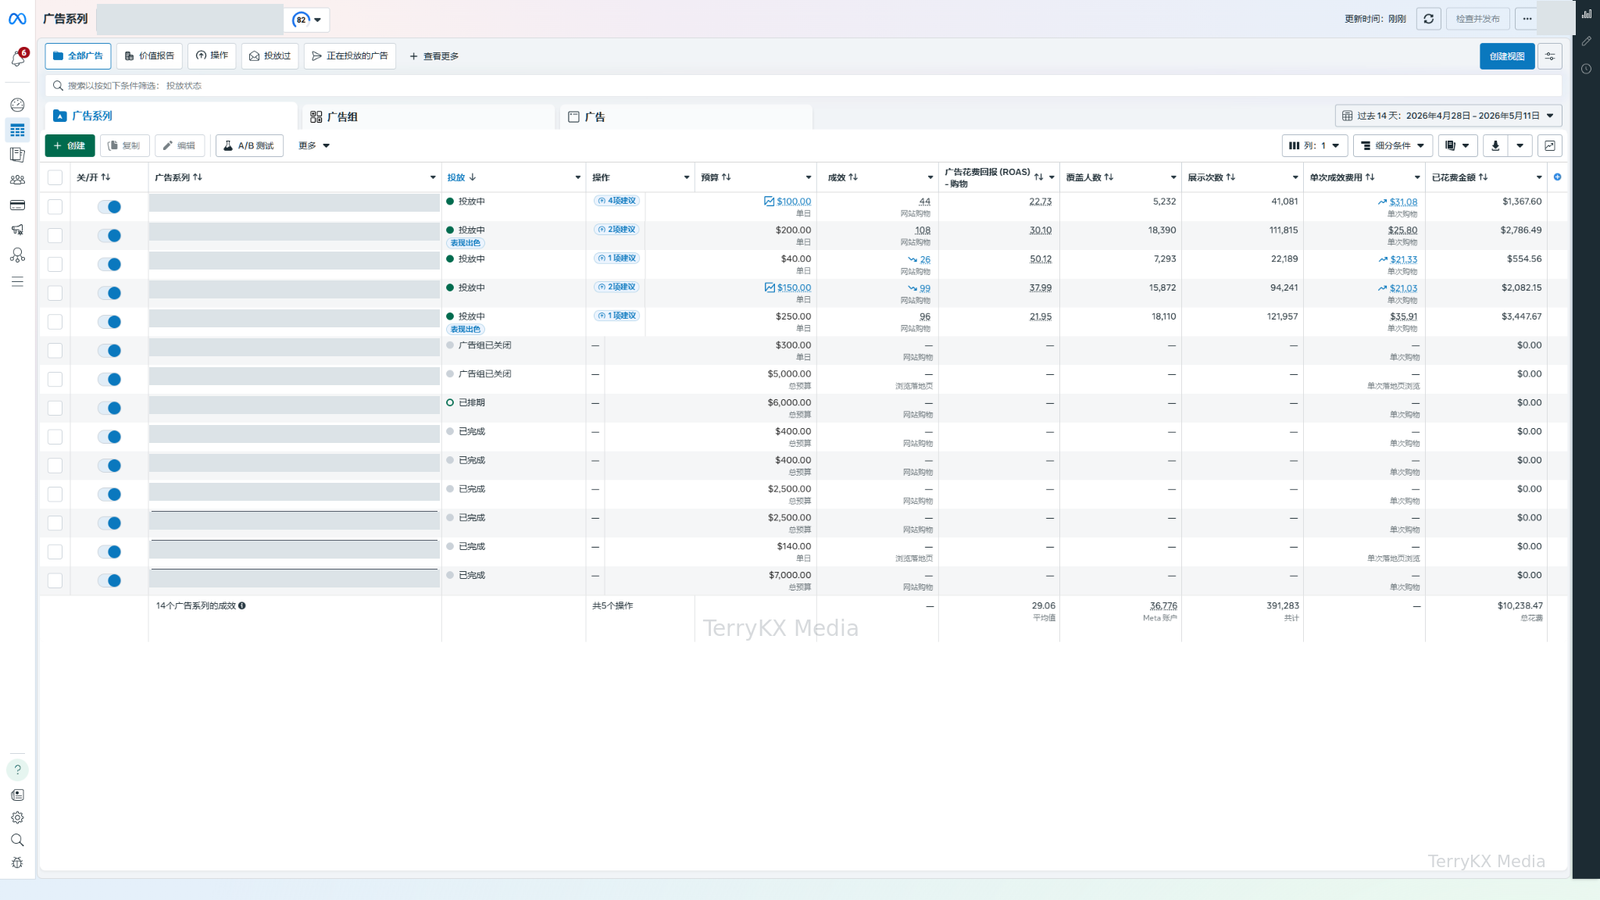
Ad spend: $10,238.47. Visible cost per purchase: $21.03–$35.91.

Five visible website purchase campaigns report 373 purchases in total. Ads Manager displays $10,238.47 in ad spend and 29.06x average purchase ROAS; purchase conversion value is not visible and has not been inferred.

GA4

Paid Search Measurement
Aug–Sep 2023

GA4 advertising performance report

16.72x

Paid Search ROAS

1,224.10

Attributed conversions

Reporting period
25 Aug 2023 – 21 Sep 2023

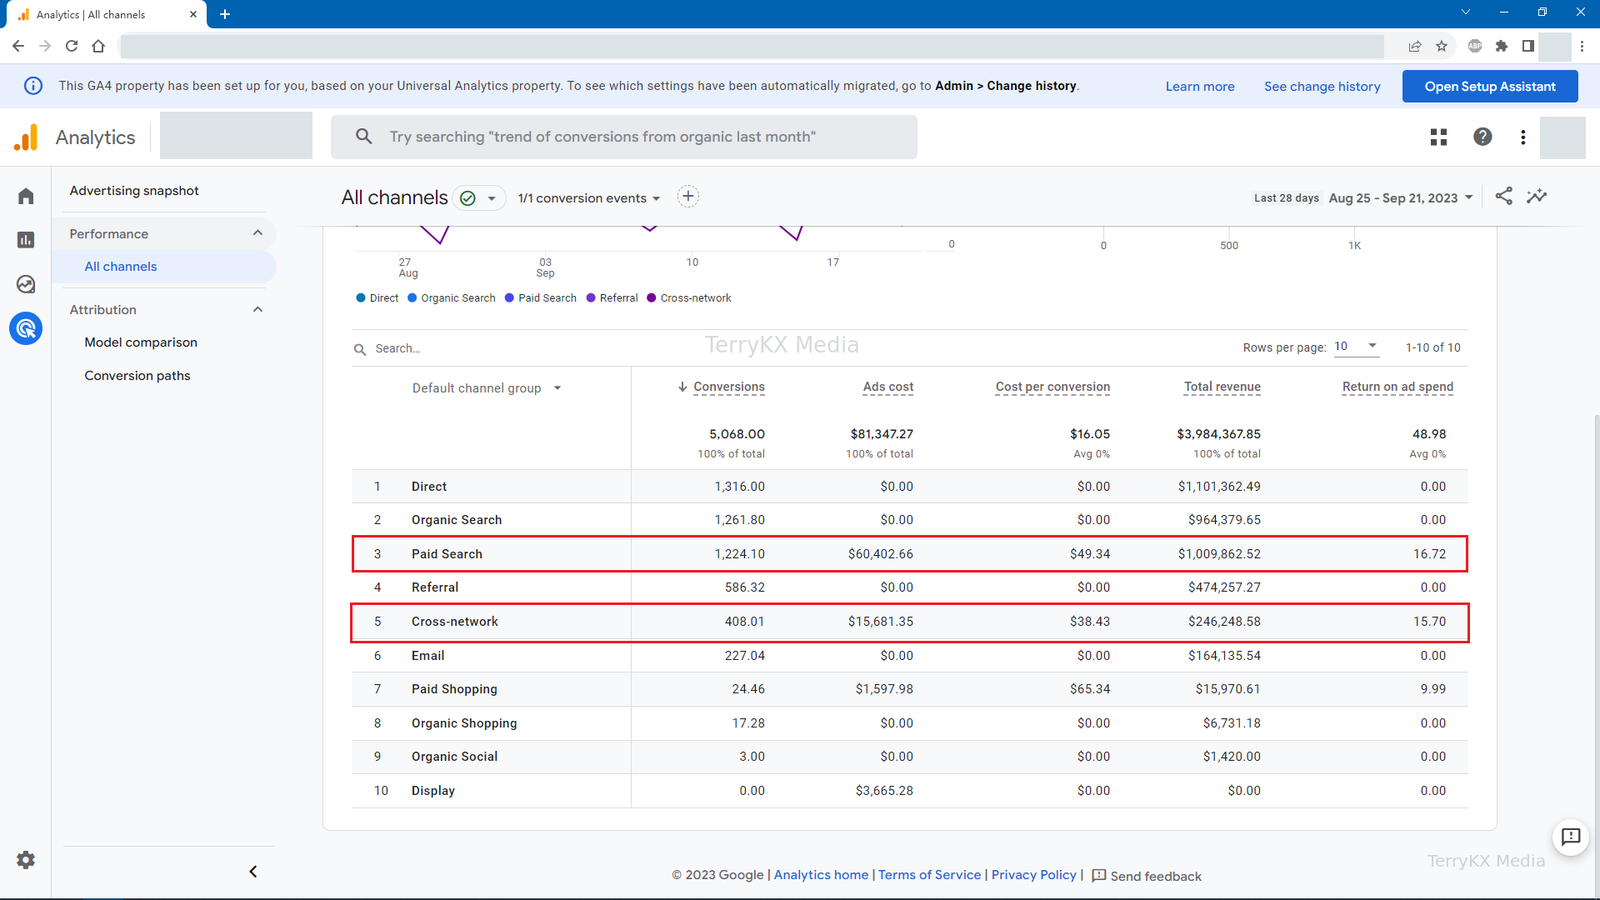
Paid Search ad cost: $60,402.66. GA4-reported revenue: $1,009,862.52. Cost per conversion: $49.34.

The GA4 Paid Search row reports 1,224.10 attributed conversions and 16.72x return on ad spend. The fractional conversion count is preserved as reported; these are channel-level attribution figures, and GA4-reported revenue is not independently verified business revenue.

Figures are platform-reported for the dates shown. Rounded Google Ads values are marked ≈. The screenshots use $ without a currency code. “Visible purchases” totals only the purchase rows shown. Calculated ROAS is purchase conversion value divided by ad spend. Average purchase ROAS is reproduced as shown, and GA4 figures relate to the named channel. Purchase conversion value and GA4-reported revenue are not independently verified business revenue.

These are report entries, not a count of separate clients. Case 006 groups platform and placement views with the same dates and six matching totals; those views are not added together. Other overlapping periods remain separate because a shared project or account has not been verified. No lead-generation result or client strategy is claimed without supporting material.

Need Help Improving Your PPC Campaigns?

Let’s discuss your advertising goals and how I can help manage and optimize your campaigns.